Refining the UK’s critical minerals vulnerability
Digging into the UK Critical Minerals Intelligence Centre (CMIC)'s 2024 Criticality Assessment.
In its second outing, the UK’s Critical Minerals Intelligence Centre (CMIC) has upped the number of minerals it deems as critical to the UK economy to 34, from its previous list of 18.
The expanded list in the Criticality Assessment is based on 2018-22 data, and is mostly due to assessing more candidate materials.
The revised methodology includes environmental, social and governance standards (ESG) and is based on quantitative data from a variety of sources, including the British Geological Survey’s (BGS) World Mineral Production, trade databases, industry and academic literature, and UK economic statistics.
The new assessment examined 82 possible materials, in contrast to 26 previously. Although most critical minerals kept their status, palladium fell just below the new threshold due to its relatively wider geographical distribution of supply compared to other platinum group elements.
Copper too is surprising by its absence, but deemed by the assessors to be well-supplied. A new entrant, iron, scores highly for criticality, due to its use in infrastructure.
Established in April 2022 to support delivery of the UK Government’s Critical Minerals Strategy, the CMIC’s purpose is to analyse supply chains and provide impartial advice on securing sustainable supplies. It is based at the BGS and funded by the Department for Business and Trade.
The CMIC says knowing which raw materials are critical to the UK enables risk to be mitigated through strengthening supply chains, developing trade relationships, supporting domestic production, and embracing recycling and other circular economy strategies.
The revised list reportedly aligns with other similar global assessments, such as that of the EU. An updated government strategy on critical minerals is due this spring.
Plotting the pinch points
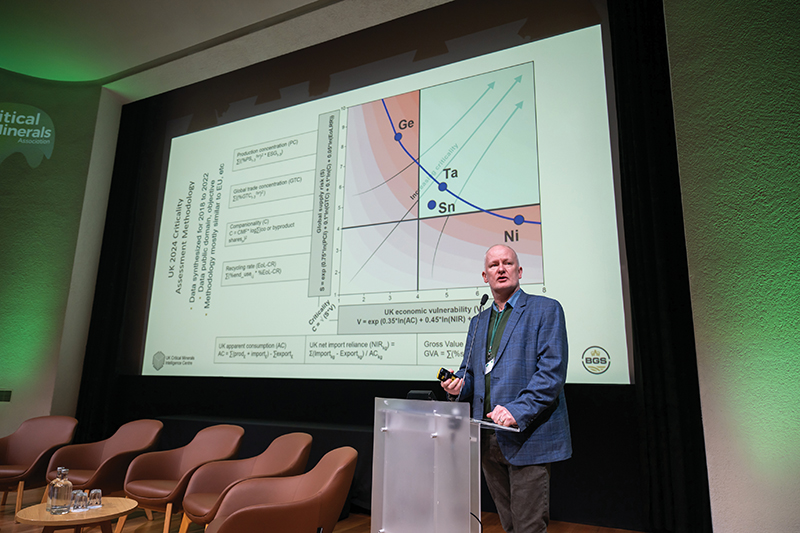
CMIC Director Dr Gavin Mudd oversaw the assessment’s release. He has been in post for just over a year, having moved from the Royal Melbourne Institute of Technology University in Australia. As an environmental engineer, he has spent much of his career researching the impacts of mining from a resource perspective.
In response to palladium dropping its criticality status, Mudd thinks this is because it is more dispersed in its production with strong recycling rates. Mudd does acknowledge that 40% of palladium is Russian, which is obviously problematic, but he believes they have declining ore grade.
He notes that the various platinum group metals plot differently in the UK (see image below) than the EU’s assessment, while iron, copper and nickel plot pretty much the same.
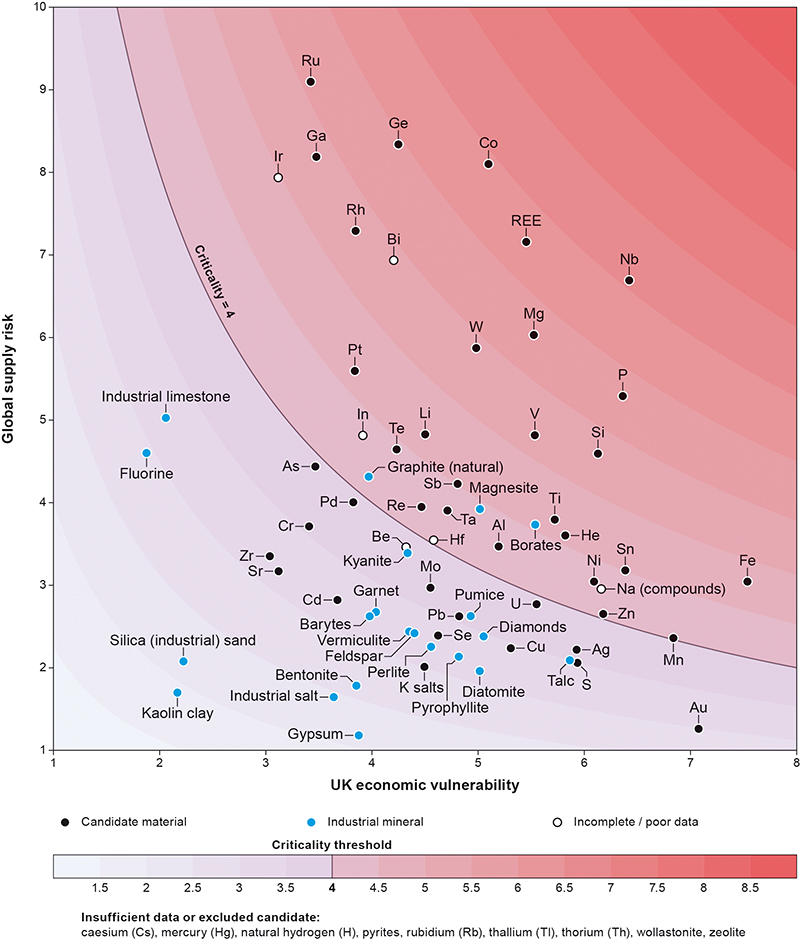
Unlike the previous quadrant approach, the new assessment uses a threshold curve that models global supply risk on the Y axis against UK economic vulnerability on the X axis.
The global supply risk is a formula of four indicators of potential bottlenecks to supply – namely, production concentration, companionality, global trade concentration and recycling rates.
The production concentration analyses the candidate material at mining stage and, where data is available, at refining stage using BGS stats and other sources, such as the US Geological Survey (USGS).
The production concentration identifies the top three producing countries and the proportional market share, and then uses a formula – with an ESG indicator – to reflect additional risk from lower governance, civil unrest or pollution.
The ESG factor is a mean of three indicators – the World Governance Indicators from the World Bank, the Environmental Performance Index from the Universities of Yale and Columbia in the US, along with the World Economic Forum, and the Human Development Index from the UN.
This is the closest way they are able to factor in geopolitics Scoring the environmental performance of individual mines for 82 commodities is not realistic, Mudd explains.
The companionality indicator measures how much a material or mineral is a co-product or by-product from another material, as only a limited number of raw materials are primary products and so are the focus for commercial viability.
By-products typically come at refining stage, and so their supply is less responsive to changes in demand than primary commodities and can create supply bottlenecks.
The report cites examples such as copper, iron, aluminium, tin and gold, which have long-establised economic value, whereas cobalt can be a co- or by-product of copper or nickel, or tellurium can be a by-product from copper or gold refining.
So, if copper demand increases, tellurium production is affected, regardless of changes in its demand. And the interdependency introduces supply constraints and price volatility.
The global trade concentration indicator is measured by data from the UN Comtrade and UK Trade Information, as well as supplementary sources such as the International Trade Centre and HM Revenue & Customs. The UN Comtrade system applies codes that delineate materials and their uses. The top three net importers for each candidate material is calculated using the Hirschmann-Herfindahl Index formula and the score is then normalised on a scale of 1-10.
The calculation of end-of-life recycling collection rates of each candidate material uses methodology from Graedel et al, the 'great grandfather of industrial ecology Tom Graedel at Yale University', says Mudd, combined with various sources for the shares of end-use applications. This is intended to reflect global recycling rather than UK recycling rates, so the indicator is a component of the global supply risk dimension.
The Criticality Assessment notes that global supply risk would be ideally monitored for the whole supply chain to evaluate bottlenecks, but most candidate materials have incomplete or absent data at refining, processing or manufacturing stages. So, tracking one single material is very challenging.
The CMIC recommends dedicated studies on specific technological sectors as a complementary measure, as well as assessing data on ownership and financing.
Also, on the topic of by-products, Mudd notes that miners are not paid for them. The revenues generated from separating indium, cadmium and germanium from zinc at refining stage, for example, do not get passed onto the mining companies. In fact, miners incur a toxic penalty for too much cadmium.
He cites the example of Broken Hill Mine in Australia, estimating it to have produced 20Mt of zinc and being one of the biggest producers of indium globally, but 'a single nanogramme has never been credited to it'.
But as miners might not publish the data, the USGS cannot estimate reserves, says Mudd. He believes that processing all the indium from zinc concentrates would probably triple its production, without processing an extra tonne of zinc. But the lack of data creates too much uncertainty around minerals and metals supply for new technology.
In contrast, gold, iron ore and copper have extensive published data, instilling confidence in the numbers.
Mudd has some stern words for mining companies. 'They [also] have to get better at actually documenting and being transparent about what they are doing with environmental and social management at existing mines, and not just in the West, but globally. Because they can do a great job.'
He believes mine rehabilitation could easily be factored in, for example, with the possibility of 1% of revenue for a mine going to a government fund for rehabilitation.
Meanwhile, the economic vulnerability scale on the X axis is a product of three indicators: apparent consumption (in pounds sterling), net import reliance (by mass) and gross value added.
The apparent consumption combines all imports and exports of a candidate material, while the UK net import reliance quantifies the extent to which the UK relies on physical imports of a candidate material. It combines the mass of imports and exports from the UK of candidate materials in mass instead of value.
The gross value added measures the financial value of goods and services to the UK economy, but the report lists various issues, including the lack of accurate sector data, the difficulty in mapping economic value against manufacturing sectors when this activity or value is across multiple sectors, and the challenge in attributing economic importance to a candidate material, especially if the mass used is small.
Drawing a line
Unlike the CMIC threshold curve, the EU has a quadrant approach and requires the meeting of both supply and economic vulnerability.
For example, while copper and nickel always have high economic value/vulnerability, they are globally well supplied. So, they are never above the supply risk theshold for deeming critical.
But the EU has still allocated copper and nickel as ‘strategic minerals’ in its Critical Raw Materials Act. Mudd deems this a policy choice. 'There’s no science behind that because I know that it didn’t meet the criteria…From a strategic point of view, the EU is prepared to fund copper-nickel projects.'
The UK team feels their graph more accurately compares minerals at the extremes, averaging high-consequence, low-probability risk against minerals with opposite variables. That is how to rank risk assessments, Mudd declares, and the CMIC thinks this is the first critical minerals assessment to use this.
He acknowledges, however, that, 'the threshold that we chose is…subjective', but is based on a best sense of defining risk in consultation with industry, government and other stakeholders. Mudd highlights that a lot of people think of it as absolute, but it is relative.
A good example is fluorine. It scored low on economic vulnerability with a moderate supply risk. But fluorspar mining stopped in the UK in 2023, the year after all the data was gathered. So, the nation is now 100% reliant on imports, unlike previously, and the criticality score comes to around 4.8. In just one year, a non-issue mineral becomes critical. This is why the UK team expects to redo the assessment every two or three years.
The CMIC analysis is based on well-established methods in economics, such as indexes that assess how ‘open’ a market or country is. Another example is iron. Although widely mined, its production is dominated by Australia, Brazil and China. Copper is widely mined and supplied and has good economic value, Mudd comments, but the tonnage of value of its use means it does not plot as high as iron or gold in terms of economic value/vulnerability.
Mudd thinks that when people want copper to be listed as critical, they are talking about the future. Having published two global studies of copper, he sees no problem with future supplies. Data reveals 1.78Gt of copper reserves were discovered in 2013, and this increased to 3.03Gt in 2015.
'Part of the reason it’s so complex is that there’s some real science that we still don't know some good answers to yet, let alone why some deposits in the world are so much more rich in indium versus others that are so poor,' Mudd illustrates. 'For some elements, we know that geology pretty well, like rhenium.'
Regardless, the assessment gives the UK Government a platform to fly the flag for certain supply chains and minerals.
Now the team has established a new methodology, they are hoping this format can be reused in the future. Mudd says it was unrealistic to cover the whole periodic table and range of industrial minerals previously.
Since his first collaboration with Graedel at Yale, Mudd has been 'gradually ticking off the periodic table. There’s still a bunch of gaps, but I’ll get there one day'.