Model behaviour in the UK Foundation Industries
A model to enhance diversity, equity and inclusion in the UK Foundation Industries.

Many organisations nowadays are looking for help to improve their diversity, equity and inclusion (DEI) performance. This is driven by several factors, but perhaps the key one is the need to change their processes and products to those that are fit for a new zero-carbon (NZC) landscape.
For the UK Foundation Industries (FIs), this issue has particular resonance as they are responsible for 10% of the UK’s annual CO₂ emissions, and this has to change.
There are six FI sectors – cement, glass, metals, paper, bulk chemicals and ceramics. They provide 75% of all materials in the UK economy, with a value of £52bln per annum. Sales for FIs are mostly on a business-to-business basis.
Their manufacturing and construction clients will also have to be aware of the FIs’ ongoing environmental performance, as these Scope 1 and 2 emissions feed into the customers’ own Scope 3 emissions. As the FIs retool and re-equip for a NZC landscape, it is apparent that not only will higher levels of innovation be required, but new skills and methods of working will be needed. This can only be achieved if there is much greater diversity within these industries than is currently the case.
A report for UK Research and Innovation on Equality, Diversity and Inclusion in UK Foundation Industries, by the Enterprise Research Centre, noted a lack of academic and grey literature on workforce diversity and inclusion in the FIs.
The author also highlighted how the business benefits of a more diverse workforce have not been developed for FIs, despite being identified for the economy at large.
Surveying the landscape
A comprehensive survey of DEI in FIs was carried out between 2022 and 2023 by the Transforming the Foundation Industries Research and Innovation Hub (TransFIRe) to overcome this dearth of information. The survey included a semi-structured interview of around 45 minutes and a site walk of up to 90 minutes, depending on the site size and complexity.
The aim was to gather subjective evidence on how inclusive the organisation felt to a visitor to give context to the survey answers. In every visit, the emphasis was on inviting the operational staff to discuss what is happening onsite, with support from Human Resources only if the operational staff felt that they needed it.
Maturity model
Off the back of the survey, a maturity model has been developed for future researchers and in-house inclusion managers to apply within organisations.
As DEI is such a relatively recent topic in the FIs, with a lack of a rigorous and objective tool, the development of a new model seemed the most appropriate approach.
This model could be used at an initial, developmental and evaluation stage for any organisation working within the FIs, and for those organisations who are their clients.
Based on a literature review, the desirable qualities for a maturity model are identified as:
- Having only two steps in its structure
- Including a zero level
- Data can be fed from the survey directly into the model
The new maturity model should additionally:
- Not demand a high level of specialist DEI (as currently understood) knowledge
- Allow an organisation to introduce DEI capabilities as an entirely new programme
- Be navigable by staff without the need for specialist training.
During the initial, and subsequent, survey responses, it became apparent that that the model must include a low level of understanding of the subject’s relevance to many organisations.
The model also had to include survey responses that displayed an unwillingness from some organisations to even consider the subject of DEI.
The five phases were therefore developed, firstly a ‘zero’ phase to display this unwillingness to engage with some of the questions.
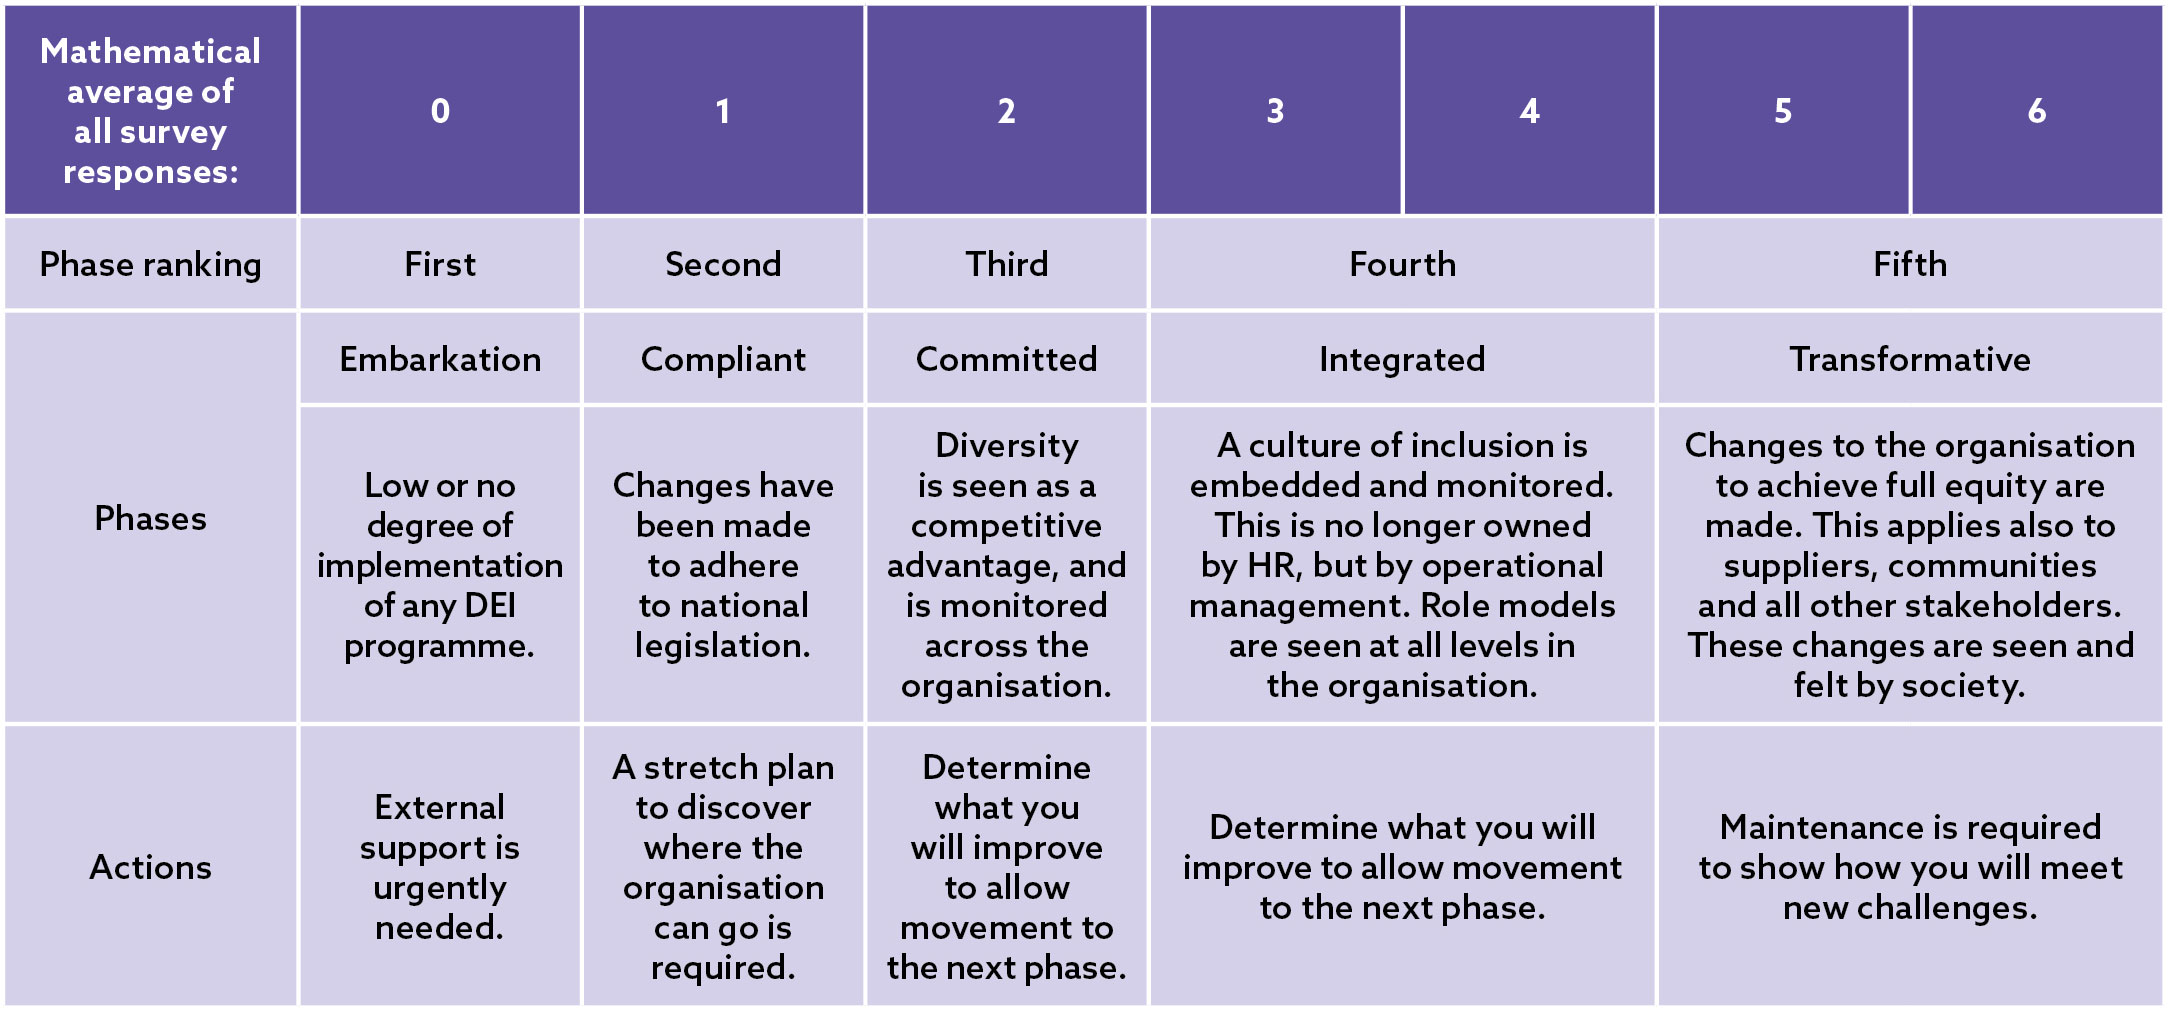
The other end of the spectrum was determined from the literature review, resulting in a fifth phase. The three intervening phases were then determined to inform where a distinct difference could be shown (see grid below).
Using the model
The model is used by applying four steps:
Step 1
Survey questions – these are shown below. The response given to each survey question is then considered by the scorer against the overarching question, ‘How is DEI positively impacted against this survey answer?’
- How would you describe the current level of awareness of DEI in the organisation?
- What are your main DEI challenges?
- How have you approached these challenges?
- If applicable, what was the outcome?
- What are your future intentions/plans for DEI?
- What DEI policy, strategy and/or targets do you have?
- What DEI roles and responsibilities do the organisation’s leaders have?
- What flexible working is offered across the organisation?
- What DEI training is offered across the organisation?
- What is the spread of Mental Health First Aiders across the organisation?
- How can employees raise innovative ideas for the organisations?
- How is DEI considered in your supply chain management?
- What data is used to support DEI work?
- How does the organisation communicate about DEI internally?
- How does the organisation communicate about DEI externally?
Step 2
The response in Step 1 is considered against the scoring matrix, shown below.
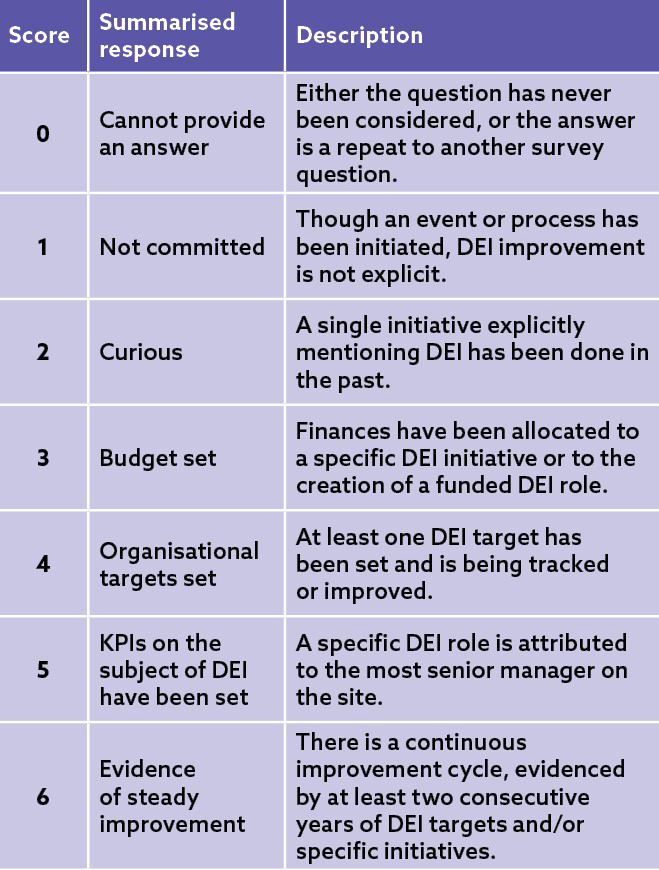
The highest level possible against each survey question is recorded, irrespective of whether lower-level responses have been achieved.
For example, an organisation may have managerial key performance indicators for DEI (so achieving a score of 5), but no organisational DEI targets have been set (so failing to reach a score of 4). The result for this survey question is a score of 5. The result then is scored similarly for each individual survey response.
Step 3
Determination of an overall score – the answers from all the survey questions are totalled and the mean average is calculated. This gives an overall score at that time for the organisation.
Step 4
The score from Step 3 is then applied to the grid below to determine which phase the organisation is working at. The required action point can then be seen. Organisations looking to improve are encouraged to look at what they scored against each survey question from Step 1.
Pilot tests
Two different organisations were chosen to validate the model (see image below).
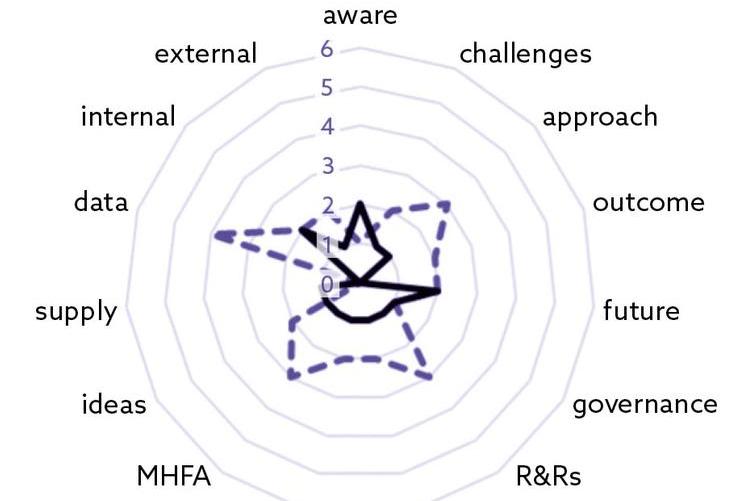
Organisation 1 is an industrial organisation. Organisation 2 is a trade association. Both work within the metals sector. Due to pre-survey agreements on anonymity, the names of the organisations cannot be published.
Overall, organisation 1 – a medium-sized, multinational producer of metal alloys – gave intermediate results ranging from 0 to 4, with a mean of 2.1 – both median and mode averages were 2.0. As the nearest whole number equals 2, this organisation is working within the compliant phase of the maturity model.
Organisation 2 – a small-sized metals trade association based in the UK – gave low results, ranging from 0 to 2, with a mean of 1.1 (median and mode both 1.0). As the nearest whole number equals 1, this organisation is working within the Embarkation phase of the maturity model.
The better score for organisation 1 was unsurprising, as multinational organisations usually have more and better developed resources to call on in areas such as DEI. The lack of a high score in either organisation was also unsurprising, as DEI is a relatively new area to the FIs.
There is a higher range of maturity across the survey responses for the multinational organisation (0 to 4) over the UK organisation (0 to 2). These equate respectively to a range of phases from Embarkation to Integrated for organisation 1, and Embarkation to Committed for organisation 2.
Both ranges include scores from the same low point (a maturity of 0), although the better resourced organisation achieved survey response scores almost twice as high as that of the other.
The largest spread in the survey responses was related to ‘How are you using data to support your DEI work?' The multinational scored 4, the other scored 0.
Future uses
Further research is needed to see how those FIs with the higher individual survey response scores (3 or above) can develop their DEI work. This could also suggest a pathway for those sectors/organisatons sitting behind these leaders.
Organisations should repeat the survey after two years to see how much the model has driven progress.
Research to look at the applicability of this model to those organisations in the value chain (mainly manufacturing and construction organisations) would be interesting, as this could help show if DEI performance increases as financial value is added through their processes. Investigating how this model applies to FIs outside of the UK, such as the Americas, Europe, and Asia, would also show how industry, academic and governmental partnerships produce different DEI outcomes.
This work was produced while the author was working as a Research Associate for Durham University, UK. For more information, contact [email protected]